


In the 2014-2015 school year, the Rockhurst math department chose to double the enrollment in our AP Calculus 1 course. This decision was based on the idea that our students deserved every opportunity, and we were confident that this number of students could be successful in an AP course. We have continued with this enrollment plan in the 2015-2016 school year.
As a brief background, the AP Calculus 1 course prepares students to take the AP Calculus AB exam. This exam is scored on a scale of one to five, with five being the best score. Most universities will accept a score of 3 or higher as a stand-in for their Calculus 1 course. We chose to expand our enrollment in this course with the confidence that the vast majority of our students would be able to achieve this score of three or higher. In this first year of expanded enrollment, we had 70 of our 96 students achieve this score. Historically, we would have around 45 students in AP Calculus 1, and they would almost all score a three or higher. This means our expanded enrollment resulted in 26 students scoring a one or a two, but it also means that around 25 students, that otherwise would not have been given the opportunity, were able to test out of Calculus 1 at the University level. The results of this first year were incredibly encouraging, but I wanted to see if there was a way to be more specific in how we identified students to be in AP Calculus 1. While I believe that there is a benefit for those 25 students that were in AP Calculus all year but did not get a three on the exam, there is the possibility that they would have benefited more by being placed in our Pre-Calculus course. Toward this end, I decided to use a statics programming package in R to look for trends in our students’ performance on the AP exam, relative to their performance on previous standardized tests. I ended up focusing on the performance on the PSAT math test. This first chart shows the relationship between the student’s most recent PSAT math score, and their score on the AP exam:
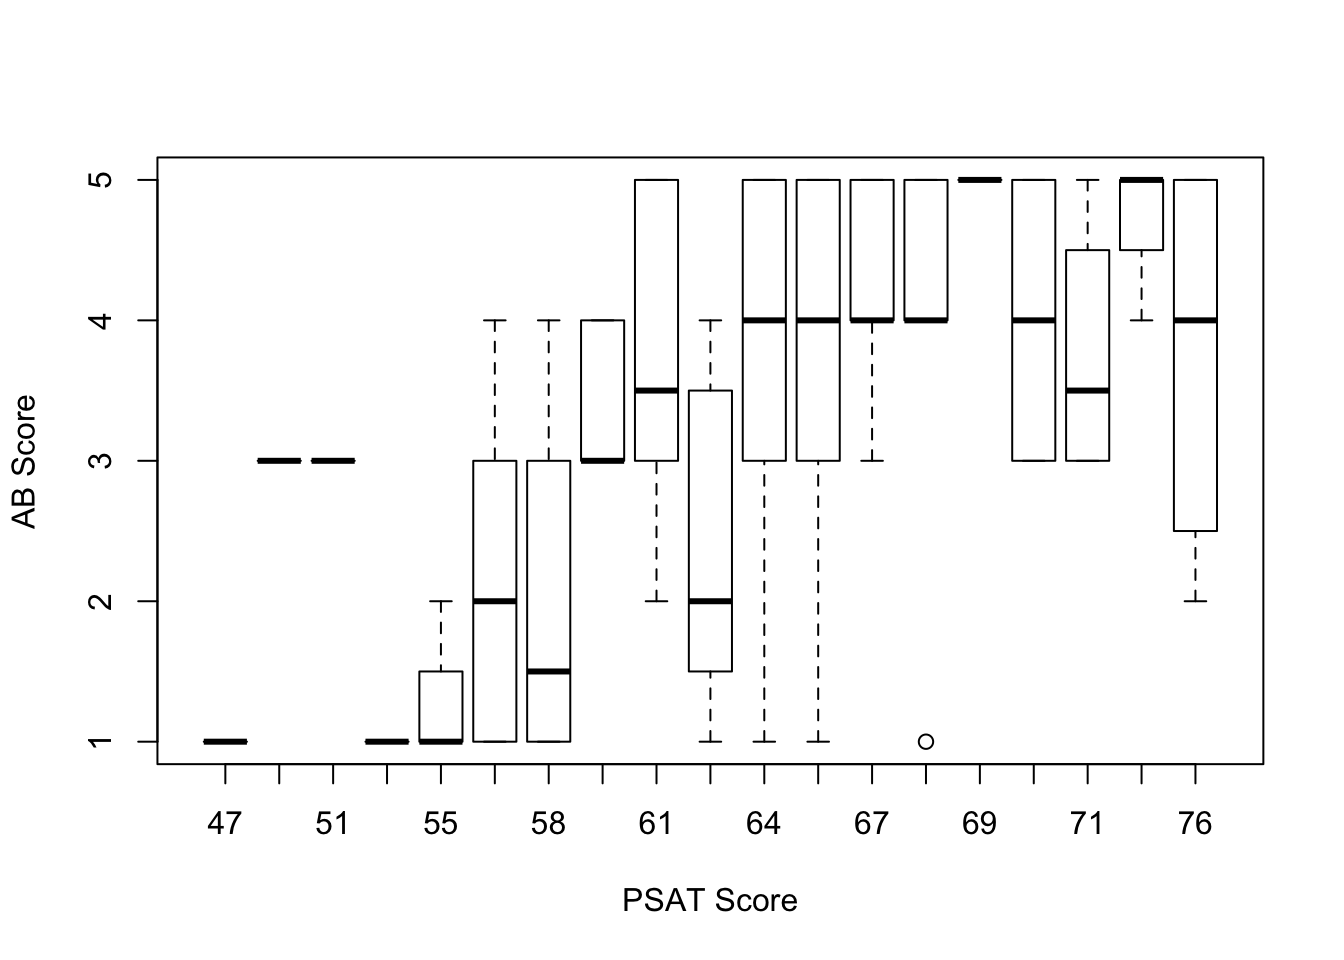
This result made it look like a PSAT score of about a 59 or higher may be a decent indicator that a student was going to be able to score at least a three on the AP exam. With this in mind, I decided to plot just the subset of students that scored less than a 60 on the PSAT math portion.
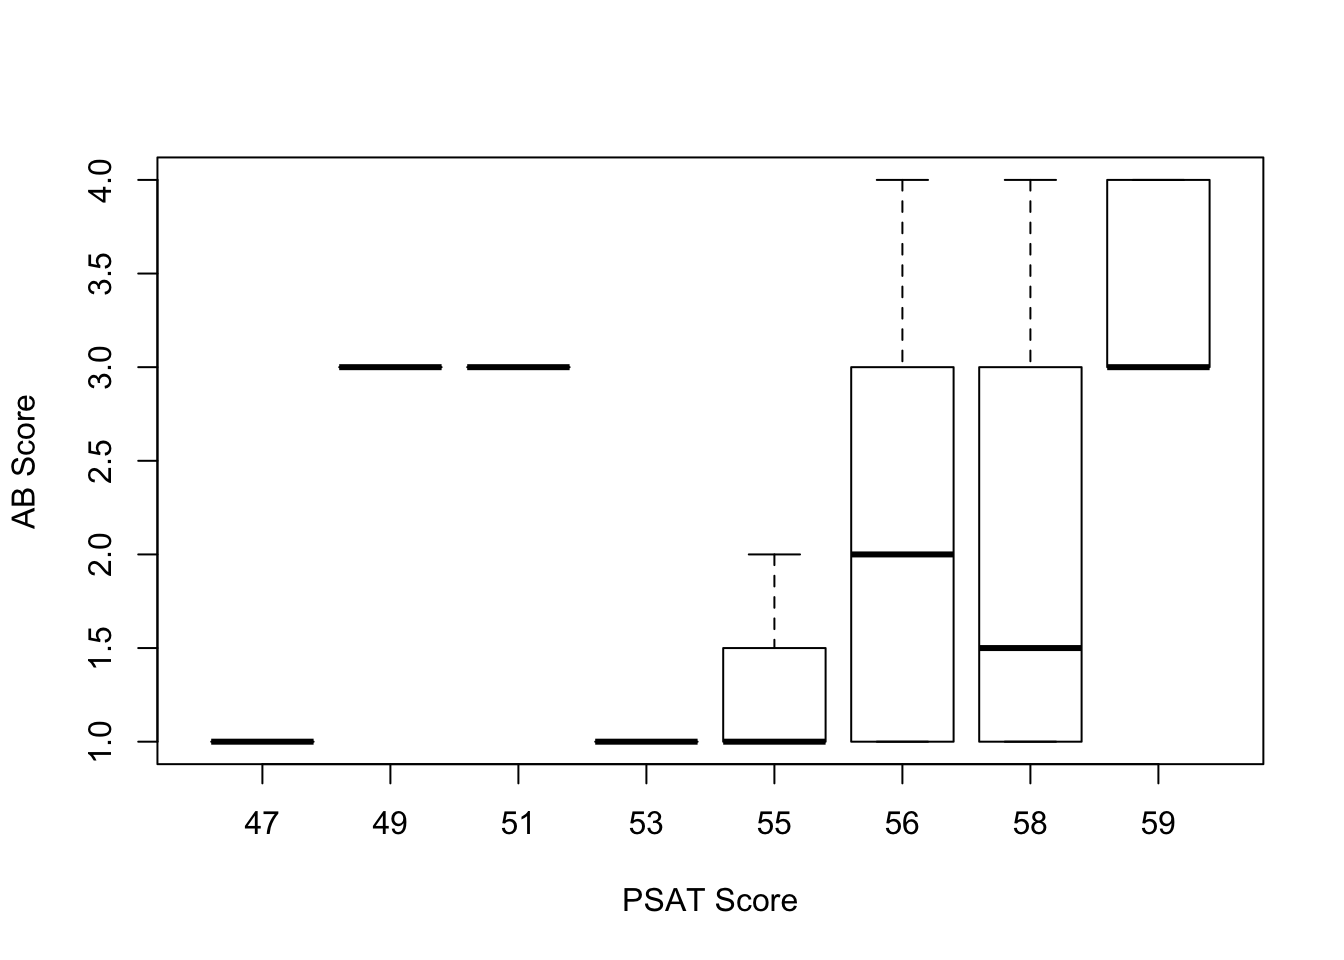
I was looking to see if scoring less than a 60 on the PSAT math section was an indicator of success on the AP exam. As it turns out, 44% of these students (that scored less than a 60) were able to get at least a three on the AP exam. The chart above shows that even our students that were scoring a 49 on the PSAT were able to score a three. Moreover, 15% of these students were able to score as high as a four on the AP exam. This exploration really gave me nothing other than a basic idea of what trends may emerge in our students’ results. We will get this year’s test results sometime in July, and at that point I will be able to get a better picture of what trends are emerging. I am excited that we have had so much success with expanding our enrollment in AP Calculus, and I am excited to continue to improve the way that we go about doing that.

Comments