

Context & Purpose
How do we assess whether or not people learn at a conference?
I felt confident that the sessions at the STEM Conference were very strong and value-added. Once the conference ended, I figured that people would feel energized, which they did. However, I wasn’t quite sure if they would learn anything. More specifically, I didn’t know how I would know if learning happened. How do we know if people learn anything during a two day event? This post describes our attempt to capture some of the learning during the conference.
Methodology
First step was to pre-test and post-test the conference attendees. During the opening session, they were asked to answer the following question:
“Please write as many things as you can that indicate successful STEM education is happening at a school.”
We used the Google Add-On PearDeck to capture all the responses. We hoped that collectively, the group would establish a more cohesive definition of successful STEM education. More importantly, we hoped that the conference attendees would use words from the 11 STEM Indicators for the STEM Certification more frequently during the post test.
Finally, we used a fancy data visualization to dynamically analyze the results - let’s check it out!
Results
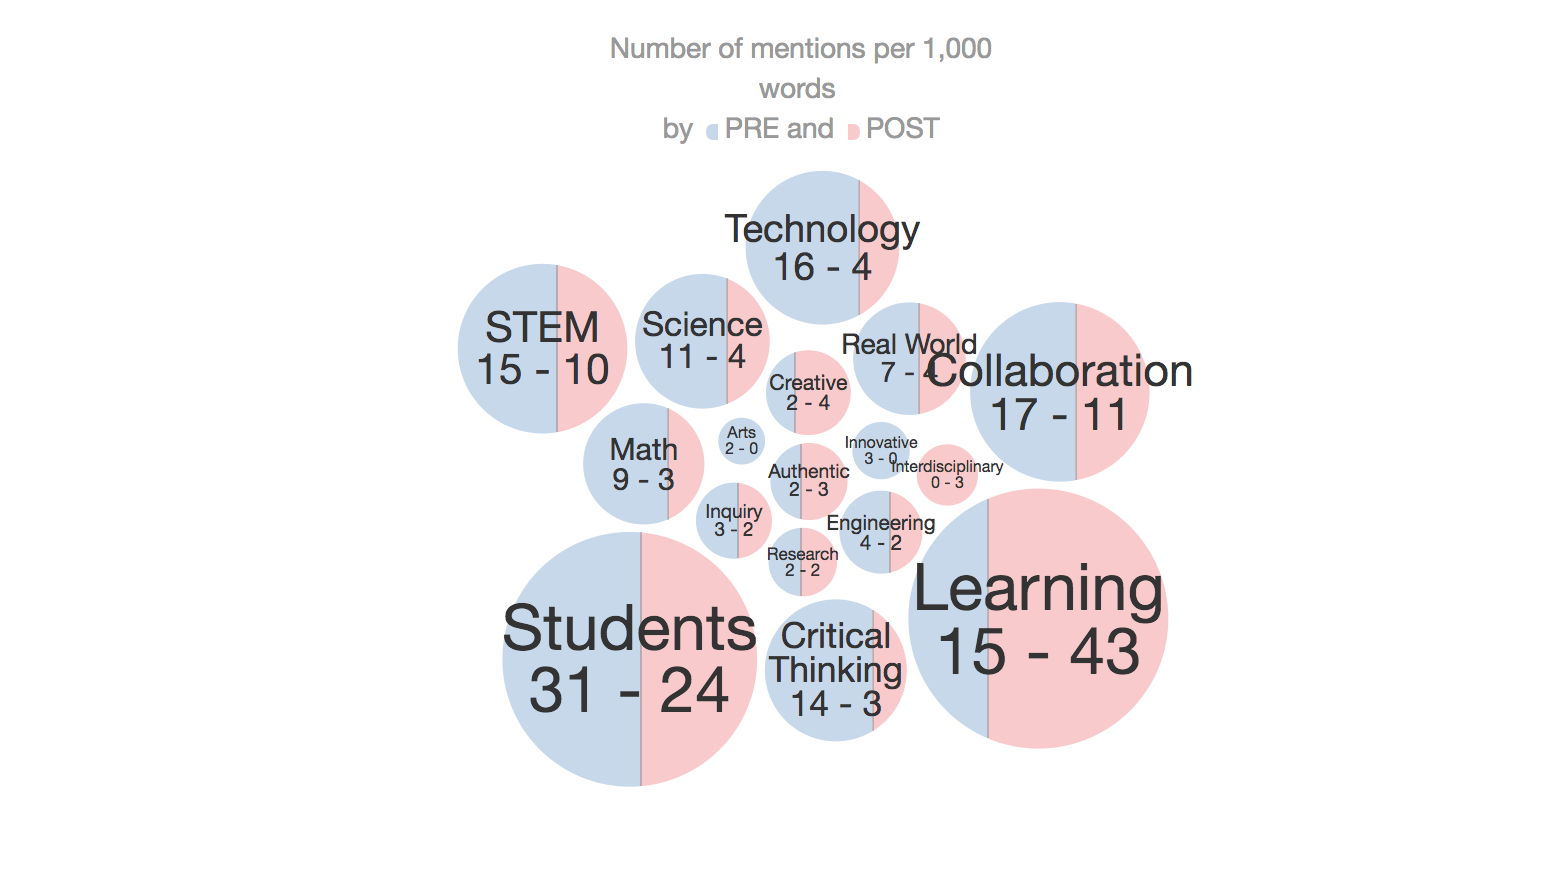
Shaded in red are the pre-test results. Shaded in blue are the post-test results. Take a look.
Things we learned:
Words that increased:
Most obviously, the word “learning” occurred nearly three times more frequently with the post test compared to the post test. This seems to emphasize the fact that successful STEM schools place a premium on those two things (phew!). On a small scale, the word ‘interdisciplinary’ went from no mentions to three - indicating a slightly broader awareness that successful STEM schools focus on more than just the acronym.
Words that occurred with the same frequency:
The words “inquiry”, “real world”, “authentic”, and “creative/creativity” all stayed about the same. This suggestions that everyone understands that successful STEM schools encourage students to be creative and work on solving authentic, real world problems. Ultimately, it is about breaking down the walls between “school world” and “real world”.
Words that went down:
The acronym! All five words: Math, Technology, Engineering, Arts and Math all decreased in use. This is a big deal. Successful STEM Education is not about what happens in isolation with those specific content area. Successful STEM Education, especially defined by the eleven AdvancED STEM Indicators includes all content areas.
User Exercise: Type the words “Active Learning”.
This Data Visual is so cool that you can actually search for words and see the new word counts pop up as a bubble above. A new “Active Learning” bubble will appear. During the pre-test there were zero mentions. The post-test, however, revealed 18 mentions per 1,000 words! Therefore, the Active Learning classrooms and philosophy at Rockhurst High School made a huge impression!
Final Thoughts
As if this data visual couldn’t get cooler, it truly is the gift that keeps on giving. Click on the bubble “Learning”. When you click on the bubble, quotes from the participants are revealed below. Go ahead and read what the conference attendees said about what indicates successful STEM education.
I think it is safe to say that some learning happened over the course of the two day conference. As educators, let us continue to work together to change the world for the better.
by PRE and POST
Language We Brought
Language We Brought
Language We Took
Language We Took
Technical Notes:
The pre-test and post-test had different total word counts (1,076 and 933 respectively). Although the totals were pretty close, it was important to normalize the output in the circumstance that word counts varied widely. Thus, we took the ratio of word count to total words and multiplied by 1,000 to generate a numbers that can be more equitably compared.
Credits:
The idea for this data visual came from Mr. William Palin, Technology Fellow at Harvard Law School. He was inspired from a New York Times piece designed by Mike Bostock. More great data visualizations can be found on Mr. Bostock’s website.
This post would not have been possible without the time and talent of Mr. J.W. Clark who built the final product in collaboration with Mr. William Palin. Like all successful STEM education, this project was a collaborative effort that yield a performance-based product.
We do our best to model STEM Learning, which I think contributed to the learning that happened at the STEM Conference.
Comments